
Transport organisations are interested in rail passengers but also the views or behaviour of people who don’t use trains.
Whether you want to understand barriers to using rail transport further, or identify possible persuasive measures, such as marketing, an evaluation of this type can provide a picture of the people who are more likely to use other modes of transport for journeys.
Your evaluation programme may involve a travel survey which collects data on both existing rail passengers and potential rail passengers. If this scenario applies to you, then it is important to read both sections in order to understand both purposes of evaluation.

Conducting an evaluation of potential rail passengers

Once the question has been defined, it is easier to design the research programme. It is important to note that the quality of the findings at the end of the research are in part a reflection of how well these questions have been addressed.

Behavioural Change
In many ways the aim of understanding the process of encouraging new rail passengers can be encapsulated under the heading ‘behavioural change’. Behavioural change is not a new area of study and has been applied to many social issues such as improving public health, rehabilitating criminals, and raising environmental awareness. In terms of transportation, changing the travel habits of people who usually travel by car to using rail travel can fulfil sustainability policy aims, by reducing their carbon footprint.
The basic idea of travel behavioural change involves changing people’s behaviour in a series of stages: for example, a person might move from not being aware of opportunities for travelling to being aware; or from thinking about changing to rail travel to actually trying it. Theories of behavioural change primarily come from the area of social psychology, and have developed over time.

By understanding more about behaviour, you can assess the willingness of the public to switch to rail.
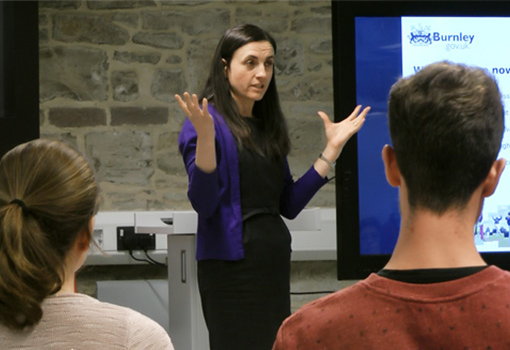
To provide answers, some form of data may be required. Data may be qualitative or quantitative. It reflects the subject of the research question, so if the question involves assessing the number of people who do not use trains, the data to be collected focuses on numbers of people. If their attitudes towards travel are of interest to the researcher, then the data must be such that it can accurately convey their thoughts and feelings. For instance the quotes in the below graphic are from the qualitative questions from the Citizens’ Rail evaluation in the Burnley area. These quotes are qualitative data and can be used in an evaluation to understand more about local people’s travel choices.

A number of considerations are important here:
- The time and resources available to the evaluation programme: this includes monetary budget, suitably trained staff, and the amount of time available to collect the data.
- How to access the data required. Are the target audience easy to reach? How does the researcher acquire data on people who do not use rail travel?
- How to ensure the data represents the target audience accurately (see the following section on sampling).
The first of these, available resources, is very important to consider before proceeding. Often a trade-off will occur and if resources are low, it might not be possible to get the best accuracy in your results.

A range of data collection methods exist to understand potential rail users, and the choice of these depends on the aims of the evaluator:
Example of a survey questionnaire form (below). This could be administered by interview, either face to face, by telephone or by email. Alternatively, it could be ‘self-completed’, and handed to the respondent for return by post.

Example of a qualitative interview question (below). The wording of the question encourages open-ended answers allowing the researcher to understand more about the individual’s circumstances, thoughts and feelings in depth, hence the longer answers. An interview may be recorded and transcribed in order for the researcher to go back and analyse the conversation more thoroughly.
Question 1) ‘In the questionnaire, you gave us some information about your most frequent journey. In order for us to find out more about this, we’d like you to let us know the surrounding context of this journey. Why do you travel by this mode? Are there any other ways you could travel and what are your thoughts about making the decision to choose one over the other? Please go into as much detail as you can.’
Example of a focus group question and answers (below). Focus group questions can be similar to those used in interviews, allowing an open-ended in-depth response. However, the difference is that, by having a number of people present, a conversation can develop. Again, recording the conversation, and transcribing it allows the researcher to be able to see what the issues are.
Focus group facilitator / researcher: ‘Think about your most frequent journey. I was wondering what people consider to be the most crucial part of their travel experience. The difference between using the mode of travel you use now, or switching to a new one.’
Respondent 1: ‘I use my car because, quite frankly it’s easier. If I’m setting off at 7.30 to be at work for now, I don’t want to be worrying about getting to the station, possibly being caught in bad weather and then a train being delayed and me being late for work.’
Respondent 2: ‘Where I live, the traffic is the problem. You can park at the station, but you might miss the train’.
Respondent 1: ‘There’s no parking for me and that’s part of the problem.’
Respondent 3: ‘This is precisely why I cycle. There are too many things that can go wrong when traffic is involved.’

Sampling involves producing results and findings which tell the most accurate story about the research situation.
If a sample is completely (100%) accurate, the data collected will reflect that of the wider population exactly. This is not going to be the case unless an entire population is sampled, which is an unlikely event. Usually, there will always be some ‘bias’, a term which means the data differs from the true picture. A sampling strategy should seek to reduce that bias as much as possible.
To understand sampling concerns further, ask the five questions: who, what, how, where, when.


One scenario which became apparent in the Citizens’ Rail evaluation was that a number of people stated they did not use rail because of certain factors on their most frequent journey. This prompted the research team to issue another follow-up survey, this time by email, to respondents who had agreed to be contacted further. The email contained a few short questions which asked people to describe the circumstances of their most frequent journey in more detail.

Storing the data is another important consideration.
They way in which this is done will depend on whether the research is qualitative, quantitative or both.
Quantitative analysis
Using a software package such as Microsoft Excel or SPSS, the data can be assessed firstly by performing a ‘descriptive analysis’ for each question asked. This will provide an idea of how the sample is made up. Are they mainly older or younger? What are their current travel habits, and so on…. The following examples provide information on how the descriptive analysis of Citizens’ Rail was carried out.
| Approximate distance in kilometers of most frequent journey | |
|---|---|
| Mean | 23.15 |
| Median | 9.66 |
| Number of respondents | 199 |
| Main Journey Purpose | Number | Percent |
|---|---|---|
| Work | 127 | 62.9 |
| Education | 5 | 2.5 |
| Shopping | 21 | 10.4 |
| Social Visit | 18 | 8.9 |
| Leisure | 16 | 7.9 |
| Healthcare | 3 | 1.5 |
| Escort | 4 | 2.0 |
| Other | 8 | 4.0 |
| Total | 202 | 100.0 |
| Main means of transport for this journey | Number | Percent |
|---|---|---|
| Car | 118 | 58.4 |
| Bus | 35 | 17.3 |
| Train | 7 | 3.5 |
| Tram | 1 | 0.5 |
| Motorbike | 1 | 0.5 |
| Bicycle | 27 | 13.4 |
| Walk | 11 | 5.4 |
| Other | 2 | 1.0 |
| Total | 202 | 100.0 |
| Have respondents heard about plans to improve their local railway? | ||
|---|---|---|
| Number | Percent | |
| Yes | 73 | 36.1 |
| No | 118 | 58.4 |
| Not sure | 11 | 5.4 |
| Total | 202 | 100.0 |
| Source of information for local plans | ||
|---|---|---|
| Number | Percent | |
| At the station | 5 | 5.7 |
| Press | 47 | 53.4 |
| Internet | 16 | 18.2 |
| Flyer | 3 | 3.4 |
| Other | 17 | 19.3 |
| Total | 88 | 100.0 |
From the above tables the following results can be deduced:
- From 199 respondents who do not currently travel by rail, the average distance of their most frequent journey is approximately 23 kilometers
- The majority of these trips are for work and car is the most used mode of travel
- More people have not heard of local plans for rail improvement than those people who have heard of the plans
- Press is the most visible place to learn about the plans
Qualitative analysis
When analysing interview or focus group transcripts, the researcher can be more flexible in their analysis, based on their aims and preferred research style. There are numerous guides and text books on how to analyse qualitative data, and the exact method chosen is at the discretion of the researcher. One starting point might be Denzin and Lincoln’s SAGE handbook of qualitative research. Essentially, the evaluation will seek to identify common themes within the data. The Citizens’ Rail research produced a number of key findings, including:
- The need for less complex more flexible ticketing
- More human presence at stations, to provide information and help passengers
- The importance of being involved in local railways
- More flexible times and less crowding on trains
Qualitative research can explore themes such as these in depth and give the evaluator a broader understanding of the issues. The way in which the data is interpreted decides which themes are important, which is why there will always be some ‘subjectivity’ (judgement is affected by personal thoughts and feelings) in the findings.

REPORT: Reporting results and findings for non-use
There are a number of ways in which findings can be reported but it is important to think clearly about where the information will appear. Here we return to the graphic from the first section, which becomes important again at this point:
- Who: Who are the target audience? Practitioners? The general public? Policy makers?
- What: What are the outcomes? Funding? Policy change? Marketing?
- Where: What are the outlets for the findings? Reports? Website? Dissemination events such as conferences?
- Why? Go back to the original aims . Are you fulfilling them? What was the overall purpose of doing the research in the first place?
- How? How can the research be used in the future? Does it solve the initial issues, such as understanding the views and behaviour of the target population? Can others draw from the findings? How can they be shared?
Whether it’s through charts, photographs, text or tables, both qualitative and quantitative data can be using an increasing number of visual and audio means. It is important to ensure the maximum reach to your intended target audience through documentation of the findings, face to face dissemination through presentations and dissemination events, and social media.
Example of a quantitative output:
Question: How much would the following encourage you to use trains more?


Whilst a chart can help the reader to make their own interpretation, be careful to ensure that a valid explanation is given. For example, the above chart details responses from people who don’t use the train, and their evaluation of the importance of car parking at the station. This chart shows that over 100 respondents answered ‘some’, ‘quite a bit’ or ‘a lot’, more combined than ‘not a lot’. It leaves open the question regarding why people differ on the importance, but other questions may show the answer to that. This is crucial in determining whether car users may consider using rail.
Example of a qualitative output:
‘My nearest railway stations are at Torre and Torquay. To get to these stations I would have to take the No 11 bus to Torquay Harbour and then get another bus to one of the stations. As far as I know there are no buses in Torquay that specifically serve the rail stations. If I have to travel by train then the best solution is to go to the station by taxi but this is expensive and not justified for social and recreational travel.’
‘It would help if the No 11 bus continued from its present terminus at Torquay Harbour and went another mile or two to Torquay Station.’
‘I think the main barrier seems to be the competition with the individual car. Unless rail offers a higher quality service in terms of time (e.g. the success of the high-speed line), fares, and flexibility (especially of service frequency), it is be difficult for it to overcome this competition.’
‘I drive to an office in Sowton, Exeter from Torquay. I am aware trains do travel on the route but the timings do not suit my work times. It is cheaper and more convenient to travel by two buses although the journey time is longer overall. So comparing public transport with driving the most convenient, cheapest etc. is the car although I would prefer not to use it every day.’
Example of a PowerPoint presentation:

More from the toolkit


Site map
Toolkit homepage | Why get involved? | Contacts for volunteers | How the rail industry works
Improve existing stations
– Early consultation
– Designing with students
– Art and gardening projects
– Community-focused buildings
New uses for station buildings
Creating new stations
More trains, better stations
Attracting more users
Involving citizens and stakeholders